Let’s Be Real: 7 Common Trading Indicators That Traders Love (and Loathe)
September 6, 2024

Trading Indicators: Why Everyone Talks About Them but Few Use Them Well
Let’s cut through the noise. If you’ve ever opened a trading platform and felt buried under a pile of squiggly lines and colored clouds, you’re not alone. Common trading indicators are everywhere—plastered across charts like badges of honor.
But here’s the truth most won’t tell you: most indicators are misunderstood, misused, or flat-out overhyped. So let’s dig into the ones traders love to use (and sometimes hate to admit they do).
1. RSI – Overused, But Still Kind of Brilliant
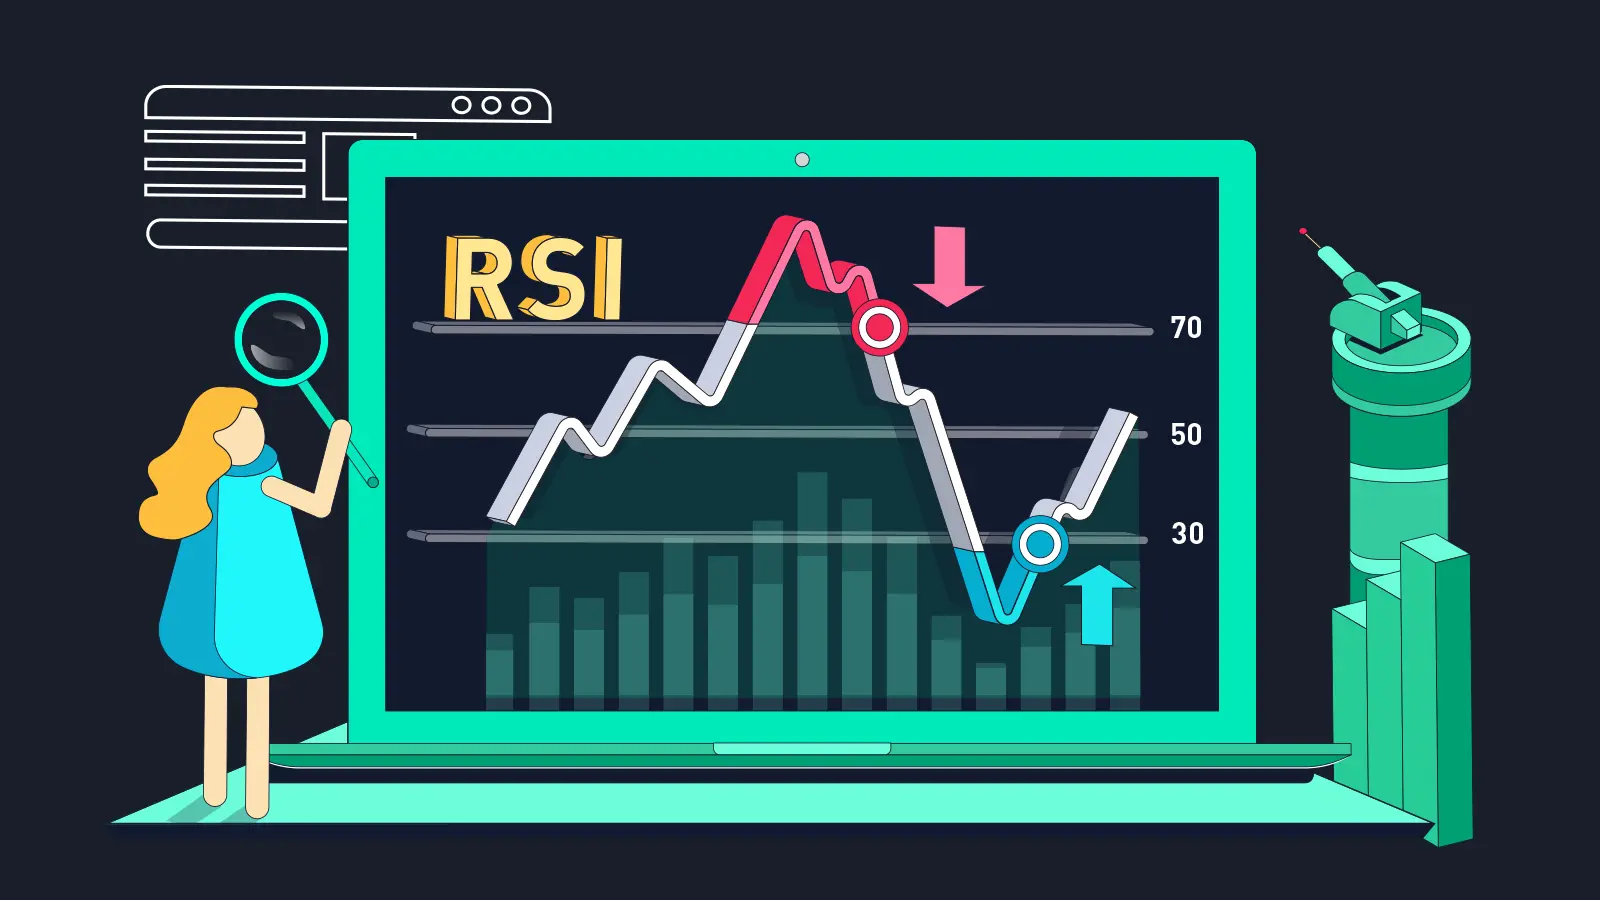
Look, RSI is on every chart—and for good reason. It tracks when a market might be overbought or oversold. But anyone who’s traded for longer than five minutes knows that just because something is “overbought” doesn’t mean it’s about to fall.
Opinion:
Useful? Yes. Predictive? Not always. It’s best used as a second opinion, not your main reason to jump in or out.
2. Moving Averages – The Smooth Talkers of Common Trading Indicators
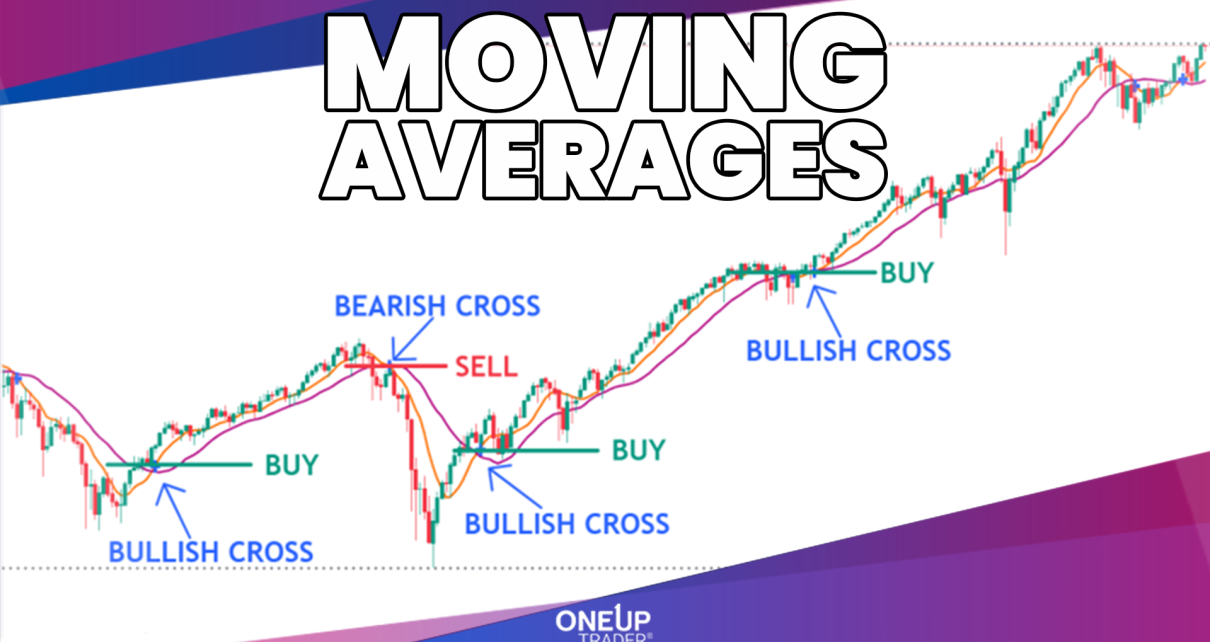
Moving averages are the ultimate crowd-pleasers. They make any chart look clean, and they’re great at showing the general direction. The crossover signals? Classic. The problem? They react late—because they’re built on past data.
Opinion:
Think of moving averages like a car’s rearview mirror—they help you see where you’ve been, not where you’re going. Still, they’re essential context.
3. MACD – Looks Complex, Acts Simple
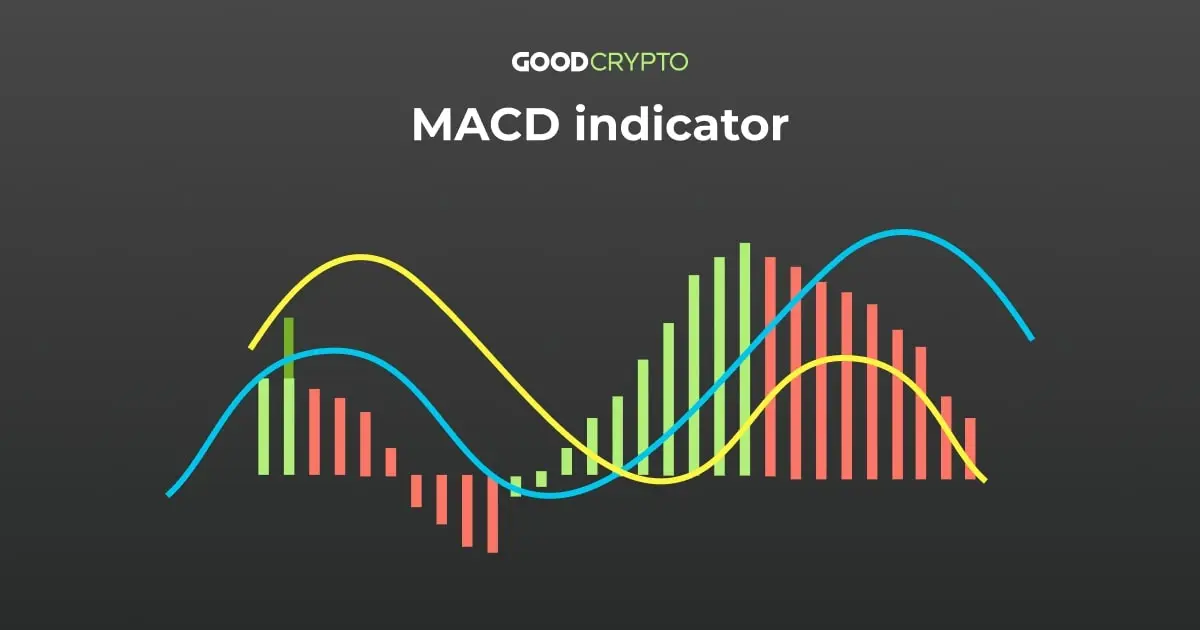
MACD tries to do it all—trend, momentum, potential entry signals. And sometimes it works like a charm. But those lines and histograms? They’re just dressed-up EMAs.
Opinion:
MACD is a solid mid-tier tool. Reliable-ish. It’s like the Honda Civic of indicators—won’t wow you, but won’t leave you stranded either.
4. Bollinger Bands – Volatility with a Side of Confusion
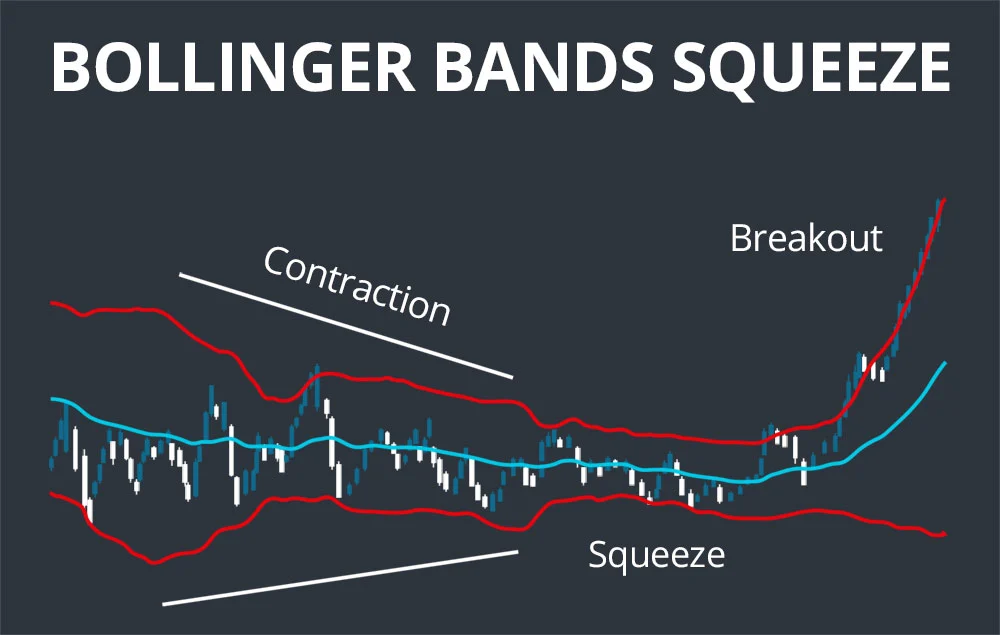
Traders love Bollinger Bands when markets are quiet. They tighten, price breaks out, and boom—you’re in business. But don’t get too cozy. Bands are descriptive, not predictive.
Opinion:
They won’t tell you which way the price is going—only that something’s probably about to happen. Great for prep work, not so great for entries.
5. Stochastic Oscillator – RSI’s Eccentric Cousin
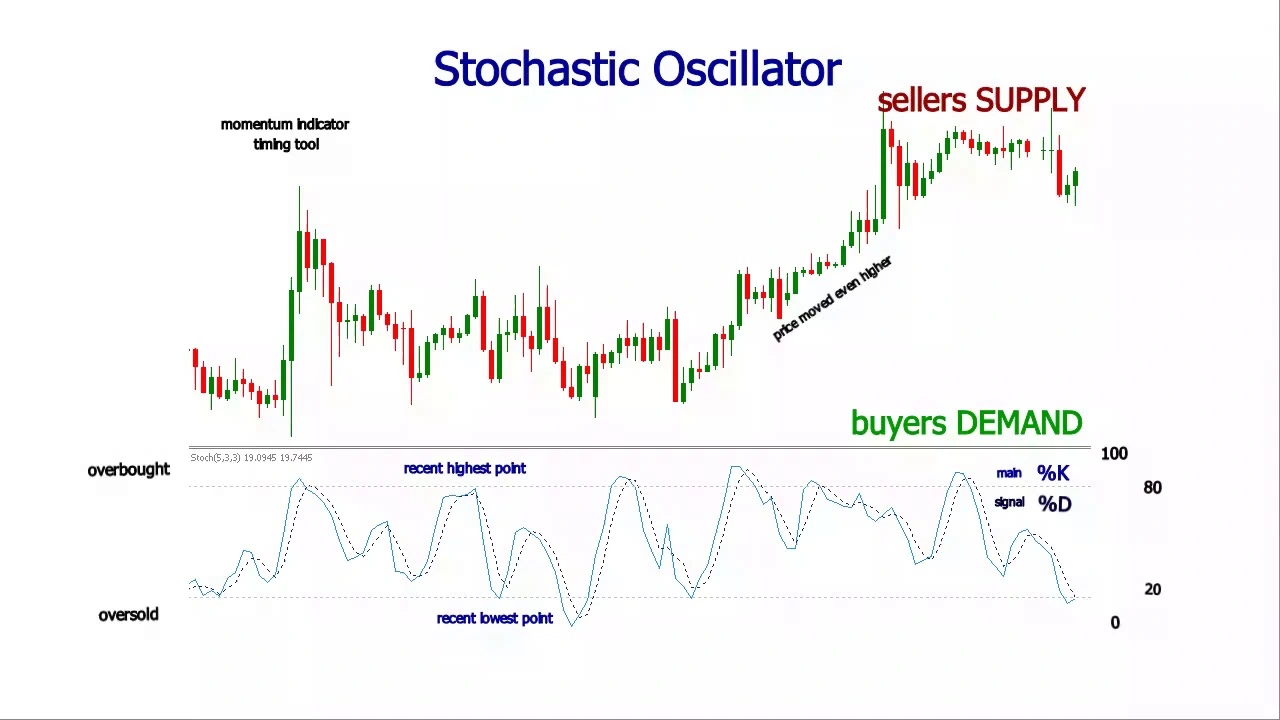
If RSI had a slightly offbeat cousin, it’d be the stochastic oscillator. Same goal: measure momentum. Different flavor: uses a price range model. When the %K and %D lines cross, traders start watching.
Opinion:
Fun to use, but noisy on shorter timeframes. Keep it slow and steady to get the most value.
6. Volume – The Most Underrated of All Common Trading Indicators

Is volume an indicator? Purists may debate that, but I’m saying yes. And honestly, it’s the one most traders ignore… until it matters. Price action without volume is like a headline without a story—empty.
Opinion:
Pair volume with literally any other indicator, and your read on the market gets sharper. Use it.
7. Fibonacci Retracement – Half Math, Half Magic
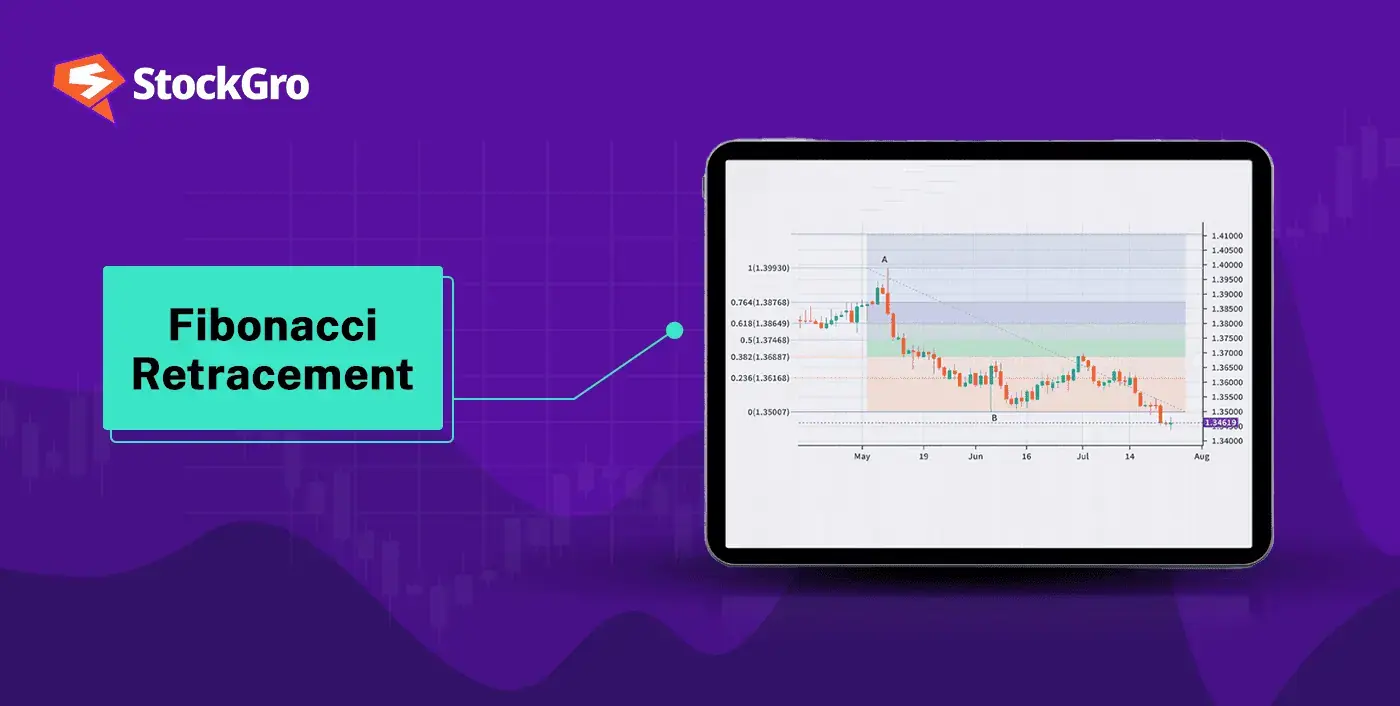
Fibonacci levels are where technical analysis flirts with mythology. Traders swear by 61.8%, 50%, 38.2%—like they’re sacred. And you know what? They often work. But mostly because everyone else believes they will.
Opinion:
Fibs are psychological checkpoints. Are they real support/resistance? Maybe. Do they matter? Absolutely.
Final Take: Common Trading Indicators Are Tools, Not Crystal Balls
Here’s where we land—common trading indicators aren’t scams or secrets. They’re tools. But like any tool, their power depends on the skill of the person using them.
Don’t expect an indicator to “tell you” what to do. That’s not its job. Its job is to help you think, question, and evaluate. Use them to sharpen your edge—not to find an easy answer.
Because the best traders aren’t the ones who use the most indicators—they’re the ones who use them best.
Relevent news: Here